Volume Profile Indicator for MT4 (Free Download)
Volume Profile is a free MT4/MT5 indicator that plots a horizontal histogram of traded volume at each price level over a chosen range. It reveals high-volume nodes (value areas where price paused) and low-volume nodes (gaps price moves through fast), helping you place support, resistance, and targets. It does not repaint completed bars.
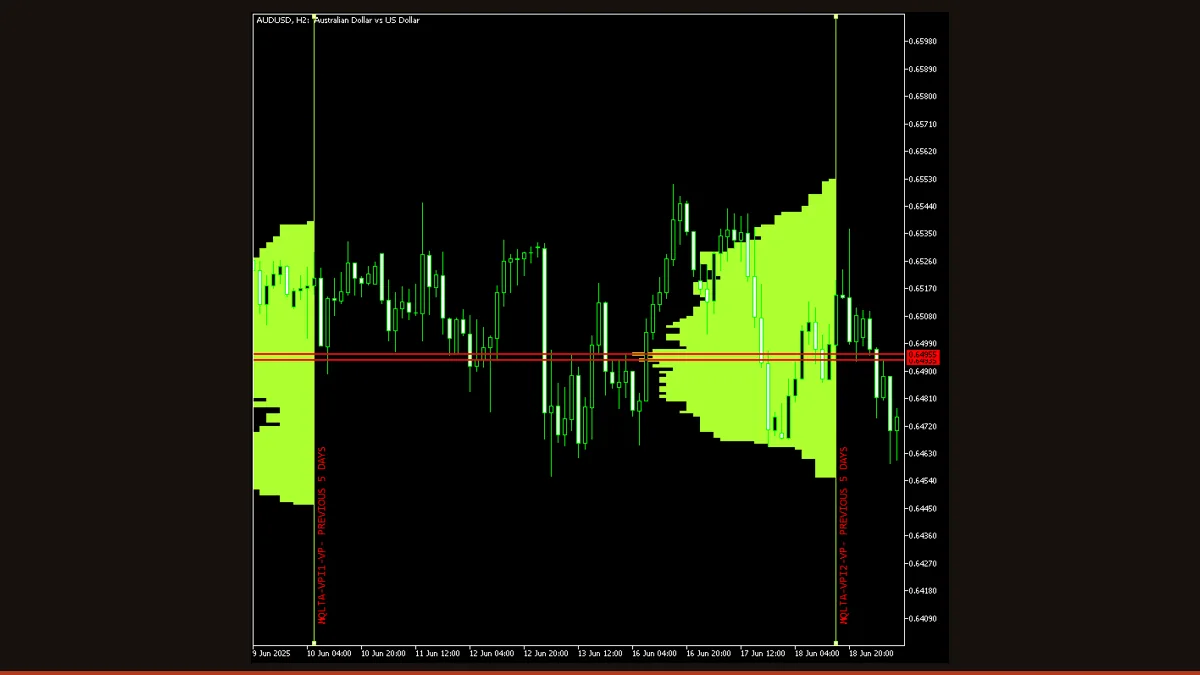
Most indicators show you volume over time, a column under each candle. Volume Profile flips that 90 degrees and shows you volume over price: a horizontal histogram running up the side of your chart that tells you exactly which price levels traded the most. Those busy levels tend to act as magnets and barriers, which is why profile-based analysis is a staple of futures and order-flow traders.
This MT4 build (it also runs on MT5) is free, open-source, and license-clear. It bins tick volume by price across a range you define, the current session, the last few days, or a custom number of bars, and draws the result so you can read structure at a glance. Below is how it actually works, every setting that matters, and the honest limitations you should know before you trade off it.
What is the Volume Profile indicator?
Volume Profile is a charting tool that measures how much trading activity occurred at each price level over a defined range, then displays it as a horizontal bar chart anchored to the price axis. Long bars mark prices where a lot of volume changed hands (high-volume nodes); short bars mark prices that the market passed through quickly (low-volume nodes). Unlike a standard volume histogram, which answers "how much volume happened on this bar," Volume Profile answers "how much volume happened at this price."
The single widest bar is the Point of Control (POC), the most-traded price in the range. Traders watch the POC and the broad cluster of high-volume bars around it (the value area) as fair-value zones where price is comfortable, and the thin low-volume gaps as zones price tends to reject or rip through. Because forex is decentralized and has no true exchange volume, this indicator uses tick volume (the number of price changes per bar) as a proxy, a well-established and usually reliable stand-in for real volume in liquid FX pairs.
How does the Volume Profile indicator work?
The logic is straightforward binning. First the indicator defines a price range to analyze, by default the most recent units of time you specify (for example the last 5 days). It slices that price range into horizontal rows whose height is set by the Step in Points input: a smaller step means thinner, more granular rows; a larger step lumps prices into fewer, fatter rows.
Then it walks every candle in the range. For each candle it decides which price rows the candle touched (using the Calculation Mode, whole candle, body only, etc.) and adds that candle's volume to those rows. If Use Volume is on, it adds the candle's tick volume; if off, it simply counts each candle once, giving you a price-frequency profile instead of a volume profile. After every candle is processed, each row's accumulated total is drawn as a horizontal bar, the longer the bar, the more volume sat at that price.
Crucially, the histogram is computed from closed historical candles, so once a bar has finished its contribution to the profile is fixed and does not get rewritten on the next tick. The only part that updates intrabar is the contribution of the current, still-forming candle, which is recalculated on the schedule set by Refresh Delay. That is why this indicator does not repaint its historical profile: past bars are settled. The profile does grow as new closed bars are added, and the current-bar slice firms up only when that bar closes, which is normal recalculation, not retroactive repainting of history.
Volume Profile settings and parameters
These are the real inputs that change how the profile is built and read. Start with the defaults, then adjust Step in Points and the range (UnitsToScan / UnitType) to match your timeframe and the pair's volatility.
| Parameter | Default | What it does |
|---|---|---|
| VPTimeFrame | Current | The timeframe whose candles feed the calculation. Leave on current to profile what you see, or lock it to a higher timeframe (e.g. H1) so the profile stays consistent when you flip chart periods. |
| CalculationMode | Whole candle | Which part of each candle counts toward a price row, the whole high-to-low range, the open-to-close body, or close only. Whole candle spreads volume across the full range; body-only concentrates it where price actually settled. |
| UseVolume | true | On = each candle adds its tick volume to the rows it touched (a true volume profile). Off = each candle counts as one (a price-frequency / time-at-price profile). Turn it off to see where price spent the most time regardless of activity. |
| StepPointsExt | 10 | Row height in points, the vertical resolution of the histogram. Smaller (e.g. 5) gives finer, more detailed nodes but a busier chart; larger (e.g. 50) merges levels into broad zones. Scale this to the pair's pip range. |
| UnitsToScan | 5 | How many units of history to include in the range, paired with UnitType. With UnitType = Days, a value of 5 profiles the last five days. Increase for a wider structural view; decrease to focus on recent action. |
| UnitType | Days | The unit that UnitsToScan counts, days, weeks, months, or a raw number of bars. Days and weeks anchor the profile to session structure; bar-count gives you a fixed-length rolling window. |
| CleanLineAtClose | true | Removes the vertical separator line drawn at the end of each completed profile period, keeping the chart cleaner when you profile multiple sessions side by side. |
| RefreshDelay | 10 | Seconds between recalculations of the most recent, still-forming candle. Higher values reduce CPU load on slow machines; lower values keep the current-bar slice of the profile more up to date. |
Pros and cons (the honest version)
What it does well
- Shows where volume actually traded, not just when, exposing support/resistance levels that price-only tools miss.
- The Point of Control and value-area clusters give objective, data-driven zones for entries, stops, and targets.
- Historical profile does not repaint: completed candles' contributions are fixed once they close.
- Flexible range, profile a single session, several days, or a fixed bar window to match your trading style.
- Free, open-source, and runs on both MT4 and MT5; tick-volume proxy works well on liquid major pairs.
Where it falls short
- Forex has no centralized volume, so the profile is built from tick volume (a proxy), not real exchange volume, accuracy depends on your broker's tick feed.
- It is an analysis overlay, not a signal engine: it draws zones but gives no buy/sell arrows, so you must interpret it yourself.
- Very small Step in Points on a long range can spawn many chart objects and slow down a low-spec terminal.
- Low-volume thin pairs and exotic symbols give noisy, less reliable profiles than EUR/USD-class majors.
- The current period's profile keeps changing until its candles close, so the freshest node positions are provisional until the period completes.
Download Volume Profile free
Enter your email and we'll send you Volume Profile for MT4, packaged with its original Apache-2.0 licence and author credit. Come back for any of our other free indicators whenever you want one.
We never share or sell your email. One-click unsubscribe in every message.
How to install Volume Profile on MetaTrader 4
- Download the free Volume Profile zip from this page.
- Unzip it and locate the Volume-Profile .mq4 file (use the .mq5 for MetaTrader 5).
- In MT4 open File → Open Data Folder, then go to MQL4 → Indicators and copy the .mq4 file there.
- Restart MetaTrader 4, or right-click Navigator → Refresh so the indicator appears.
- Expand Navigator → Indicators and drag Volume Profile onto the chart you want to analyze.
- In the inputs window set Step in Points, the scan range (UnitsToScan / UnitType), and Use Volume, then click OK.
- Adjust Step in Points and the range until the histogram resolution suits the pair and timeframe.
Volume Profile FAQ
Does the Volume Profile indicator repaint?
No, not in the way traders fear. The histogram is built from closed candles, so once a bar finishes its volume is locked into the profile and is not rewritten later. Only the contribution of the current, still-forming candle updates intrabar, that is normal recalculation, and it settles when the bar closes.
Is this real volume or just tick volume?
It is tick volume, the count of price changes per bar, because spot forex has no centralized exchange to report true traded volume. On liquid major pairs tick volume tracks actual activity closely and is a reliable proxy; on thin or exotic symbols it is noisier.
What is the Point of Control and why does it matter?
The Point of Control (POC) is the single price level with the most accumulated volume in the range, the longest bar in the histogram. Traders treat it as a fair-value magnet: price often returns to it, and it frequently acts as support or resistance, making it a logical reference for entries and targets.
What timeframe and range should I use?
For intraday work, profile the current or last few sessions on M15-H1. For swing levels, profile several days or weeks on H4-D1. The key is matching Step in Points to the pair's volatility so the histogram is detailed but not cluttered.
Does it work on MT5 as well as MT4?
Yes. The download includes an MT4 (.mq4) version and an MT5 (.mq5) version. The logic is the same on both platforms; just copy the matching file into that platform's Indicators folder.
Is the Volume Profile indicator free?
Yes. It is free to download and open-source under a permissive license, so you can use and modify it without cost. It is an analysis tool, not a trading system, it draws volume zones; you decide how to trade them.