Market Profile Indicator for MT4 (Free Download)
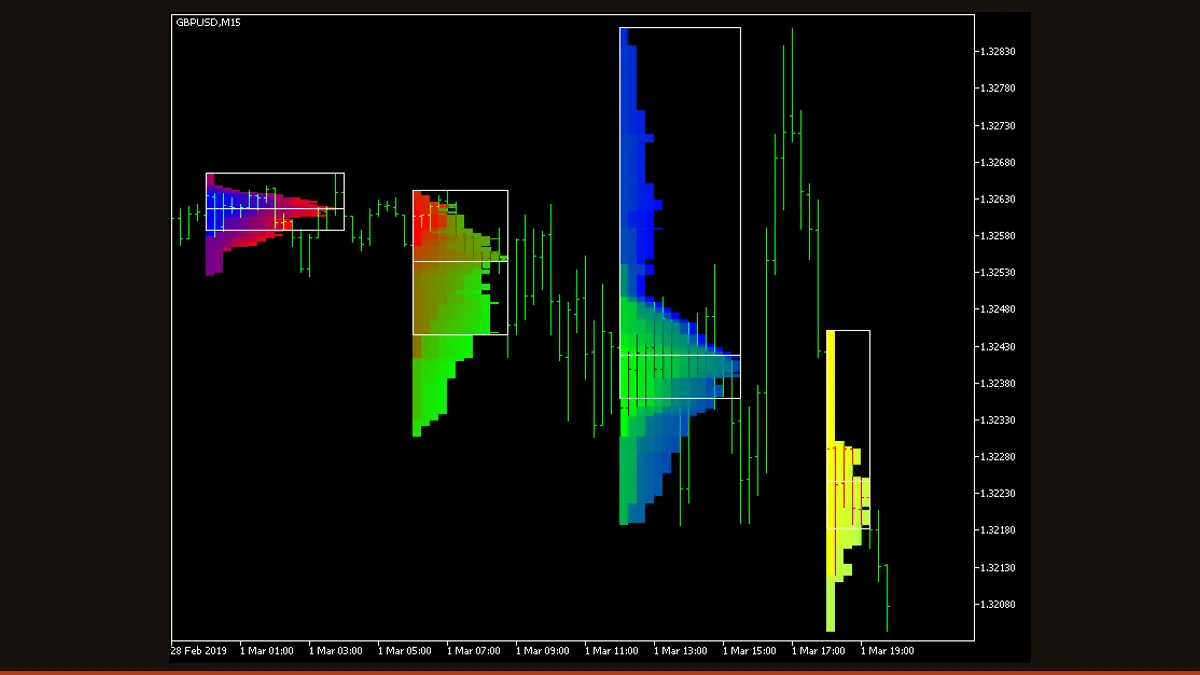
Market Profile is a free MT4 indicator that organizes a session's price action into a TPO histogram, then marks the point of control, the 70% value area (VAH/VAL), and single prints. It shows you where price spent the most time, helping you find acceptance zones and likely support and resistance.
Most chart tools answer "where is price going?" Market Profile answers a different, often more useful question: "where has price actually spent its time?" Instead of a line or an oscillator, it draws a sideways histogram for each trading session, building a fingerprint of how the market distributed activity across price levels.
This is a free, license-clear MT4 build of the classic Market Profile concept. It plots the value area, the point of control, and single-print zones directly on your chart, with optional intraday sub-sessions, developing levels, and break alerts. Below we explain exactly how it works, the settings that actually change its behavior, and where it helps and where it does not.
What is the Market Profile indicator?
Market Profile is an MT4 indicator that reorganizes a session's price action into a horizontal histogram of Time-Price Opportunities (TPOs) to reveal the levels where the market traded most heavily.
The technique dates back to J. Peter Steidlmayer's work at the Chicago Board of Trade in the early 1980s. Rather than plotting time on the x-axis like a normal candlestick chart, Market Profile stacks letters (or colored blocks in this build) at each price level the market touched during a session. Prices that were visited across many time periods build a wide bulge; prices that were touched only briefly form thin tails. The result is a distribution curve turned on its side, showing you the market's "fair value" zone versus the extremes it rejected. This is a charting and analysis tool, not a buy/sell signal generator.
How does the Market Profile indicator work?
The indicator splits the chart into sessions (daily by default, or up to four custom intraday sub-sessions) and processes each one independently. Here is the actual logic:
1. Build TPOs. The session is divided into time blocks based on the TPOTimeframe (for example, 30-minute bricks). For every block, the indicator records each price level the bar touched and places a TPO mark there. Levels touched in many blocks accumulate many marks and form the wide part of the histogram.
2. Find the Point of Control (POC). The single price level with the most TPOs, the most-traded, most-accepted price of the session, is the POC, drawn as the median line. It is the histogram's peak.
3. Calculate the Value Area. Starting from the POC, the indicator expands outward, adding the next-busiest levels until it has captured the percentage of total TPOs set by ValueAreaPercentage (70% by convention). The top and bottom of that band are the Value Area High (VAH) and Value Area Low (VAL). Roughly 70% of the session's activity happened between them; this is the session's accepted range.
4. Mark single prints. Levels touched in only one time block, thin, fast-moving zones where price found no acceptance, can be highlighted as single prints. They often act as gaps that price revisits later.
Because the profile is constructed from completed TPO blocks, the finished histogram for a closed session does not repaint, those bricks are locked once their time period ends. The exception is the live, in-progress session: while it is still forming, its POC and value area naturally shift as new TPOs arrive, and the optional Developing POC / Developing VAH-VAL features deliberately show that evolution in real time.
Market Profile settings and parameters
This build exposes roughly 90 inputs, most of them cosmetic (colors, line styles, alert plumbing). These are the parameters that genuinely change how the profile is calculated and displayed:
| Parameter | Default | What it does |
|---|---|---|
| Session | Daily | Sets the profile period: Daily, Weekly, Monthly, Intraday (your own sub-sessions), or Rectangle. This is the single biggest driver of what the histogram represents. |
| SessionsToCount | 2 | How many recent sessions to draw at once. Raise it to compare today's value area against prior days; high values create more chart objects and slow redraws. |
| ValueAreaPercentage | 70 | The share of total TPOs that defines the value area. 70% is the convention; lowering it tightens VAH/VAL around the POC, raising it widens them. |
| TPOTimeframe | PERIOD_CURRENT | The time block used to build each TPO row. Must equal or exceed the chart timeframe. A 30-minute TPO on an M5 chart gives the classic granularity; larger blocks coarsen the profile. |
| EnableDevelopingPOC | false | Plots the POC as it evolves bar-by-bar through the live session. Useful for watching value migrate, but this line moves until the session closes. |
| EnableDevelopingVAHVAL | false | Same idea for the value-area boundaries: shows VAH/VAL forming in real time. Expect movement on the unfinished session. |
| ShowSinglePrint | No | Highlights single-print levels (touched in only one TPO block). These thin zones often act as price magnets and reference points later. |
| ShowValueAreaRays | None | Extends previous sessions' VAH/VAL forward as horizontal rays so old value boundaries become live support/resistance references. |
| ShowMedianRays | None | Extends previous sessions' POC lines forward as rays, often the most-watched single levels on the chart. |
| PointMultiplier | 0 | Performance control: groups price levels to reduce the object count. 0 is adaptive; raise it on tick-heavy pairs or low timeframes if the chart lags. |
Pros and cons (the honest version)
What it does well
- Shows where price was actually accepted (POC and value area) rather than just where it moved, a genuinely different read of the market.
- The finished histogram for a closed session does not repaint; locked TPO blocks stay put.
- VAH, VAL, and POC give objective, rule-based support and resistance levels you can mark trades against.
- Flexible session control: daily, weekly, monthly, or up to four custom intraday sessions with independent color schemes.
- Optional rays project prior value areas and POCs forward, and native/email/push alerts can fire on breaks, no constant screen-watching.
- Completely free, with the source available, and runs on MT4, MT5, and cTrader.
Where it falls short
- There is a real learning curve, TPOs, value area, and single prints are unfamiliar to traders used to moving averages and oscillators.
- The live, in-progress session's POC and value area shift as new TPOs arrive; the Developing POC/VAH/VAL lines move until the session closes (this is by design, not a bug).
- Forex has no true centralized volume, so this is a time-based (TPO) profile, not a real volume profile, it approximates participation by time, not contracts traded.
- It is descriptive, not predictive: it marks levels but gives no inherent edge or entry signal on its own.
- Heavy object counts on low timeframes or tick-dense pairs can slow the chart; you may need PointMultiplier or ThrottleRedraw to keep it responsive.
- Session start/end times depend on your broker's server clock, so you may need to set TimeShiftMinutes to align profiles with the session you actually trade.
Download Market Profile free
Enter your email and we'll send you Market Profile for MT4, packaged with its original Apache-2.0 licence and author credit. Come back for any of our other free indicators whenever you want one.
We never share or sell your email. One-click unsubscribe in every message.
How to install Market Profile on MetaTrader 4
- Download the indicator zip from this page and save it somewhere you can find it.
- Extract the zip; you should see a .mq4 file (and any included resources).
- In MT4 open File → Open Data Folder, then go to MQL4 → Indicators.
- Copy the .mq4 file into that Indicators folder.
- Back in MT4, right-click Navigator → Refresh (or restart the terminal) so the indicator appears.
- Drag Market Profile from Navigator onto your chart, set Session and TPOTimeframe in the inputs, and click OK.
- Confirm 'Allow DLL imports' is not required and that the profile draws on your current session.
Market Profile FAQ
Does the Market Profile indicator repaint?
The histogram for a session that has already closed does not repaint, once a TPO time block ends, its bricks are locked and the POC, VAH, and VAL for that finished session stay fixed. The only thing that moves is the live, still-forming session: its developing POC and value area shift as new TPOs come in, which is expected and is why those features are labeled 'developing.'
What's the difference between Market Profile and Volume Profile?
Market Profile measures participation by time (TPOs, how many time blocks visited each price), while Volume Profile measures it by traded volume. In forex there is no centralized volume, so a time-based Market Profile is often the more honest tool; the shapes usually look similar, and both highlight a point of control and value area.
What timeframe and TPO setting should I use?
The classic configuration is a 30-minute TPO on an intraday chart (M5-M30) with daily sessions, that reproduces the original CBOT-style profile. Swing traders can switch Session to Weekly or Monthly and read those on H1-H4. Keep TPOTimeframe equal to or larger than your chart timeframe.
How do I trade with the value area and POC?
Common approaches: treat the POC as a magnet and a fair-value reference, fade moves back toward it from the value-area edges, or trade breakouts when price accepts outside VAH/VAL. Prior-session VAH/VAL/POC rays often act as support and resistance. The indicator marks these levels objectively, but it does not place trades or promise any particular outcome, you supply the strategy and risk management.
Is it really free, and does it work on MT5?
Yes, it's a free download with the source available, and the same EarnForex codebase ships for MT4, MT5, and cTrader, so you can run it on whichever platform you use. Use the MT4 .mq4 build from this page for MetaTrader 4.