Murrey Math Lines Indicator for MT4 & MT5
Murrey Math Lines automatically divides the recent price range into eight equal 1/8th intervals and draws horizontal support, resistance and pivot levels from them. The strongest are the 4/8 mean line and the 0/8 and 8/8 extremes. Levels recalculate when the range resets but do not repaint on closed bars. Free for MT4 and MT5.
Murrey Math is a price-mapping system built on a simple idea: markets tend to move, pause and reverse at predictable fractions of a range rather than at random prices. Murrey Math Lines turns that idea into a grid of horizontal lines on your chart, splitting the recent trading range into eight equal slices so you can instantly see where the major support, resistance and reversal zones sit.
This free build was originally coded by EarnForex.com from Vladislav Goshkov's interpretation of T.H. Murrey's rules, and it is re-hosted here under its open licence. It runs on both MetaTrader 4 and MetaTrader 5, can draw its grid from the current chart or from a higher timeframe, and can fire native, email or mobile-push alerts when price crosses a line. Below is how the grid is actually built, the inputs that matter, and an honest look at what it does and does not do.
What is the Murrey Math Lines indicator?
Murrey Math Lines is a support-and-resistance overlay indicator that takes the highest high and lowest low over a recent block of bars, rounds that range to a tidy mathematical frame, and divides it into eight equal one-eighth (1/8th) intervals plus a couple of overshoot lines above and below. Each of those horizontal lines is treated as a price level where the market is statistically more likely to stall, bounce or break.
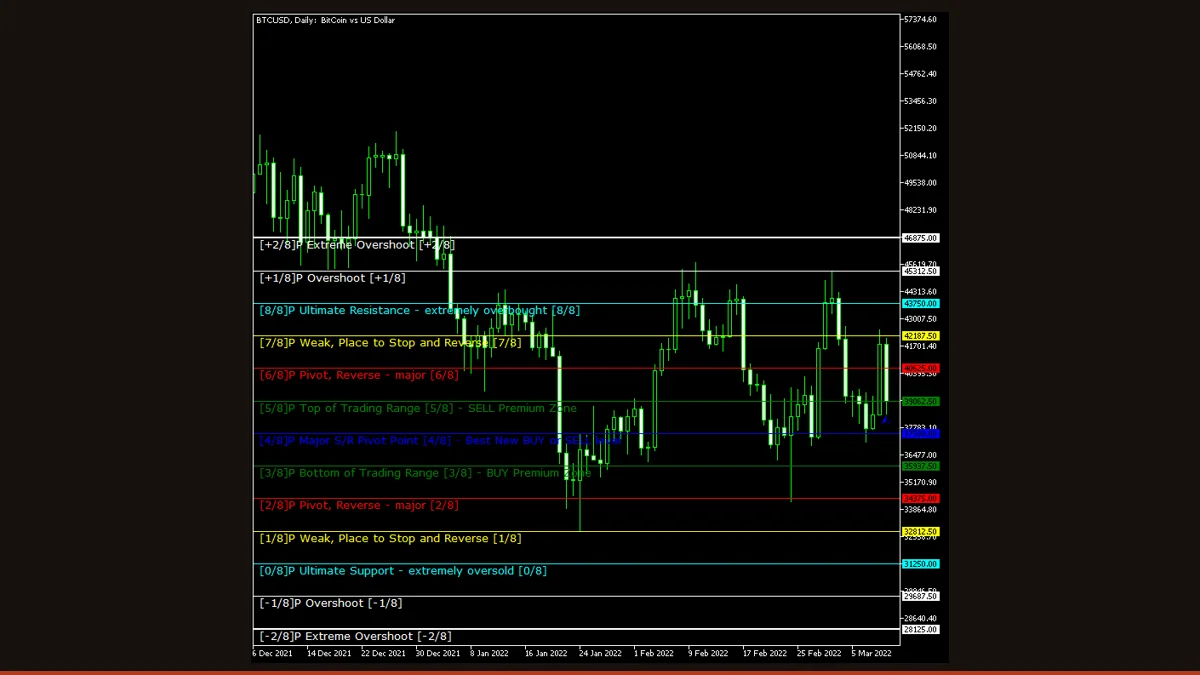
The grid is labelled in eighths, from the bottom up: 0/8, 1/8, 2/8, all the way to 8/8, with extra [-2]/8, [-1]/8, [+1]/8 and [+2]/8 lines outside the main range. The line that matters most is the 4/8 in the middle, the so-called "major reversal" or mean line, price tends to gravitate back to it. The 0/8 and 8/8 lines are the "ultimate" support and resistance of the current frame, and the 2/8 and 6/8 lines mark strong pivot and reversal zones.
How does the Murrey Math Lines indicator work?
The logic is geometric, not statistical, and it runs in three steps.
1. Measure the range. The indicator looks back over a fixed number of bars (the period input, default 64) and finds the highest high and lowest low in that window. That high-low span is the raw range it will map. You can have it measure the current chart's bars or, by setting an upper timeframe, measure the range on a higher timeframe and project those levels down onto your working chart.
2. Round to a Murrey frame. Murrey Math does not divide the raw high-low directly. It first scales the range to the nearest "octave", a power-of-two-and-ten bracket such as 0.0625, 0.125, 0.25, 1, 10 and so on, so the grid snaps to clean, repeatable price boundaries instead of arbitrary numbers. This rounding is what makes the same levels reappear across different traders' charts and is the heart of the method.
3. Split into eighths. The rounded frame is divided into eight equal parts, producing the 0/8 through 8/8 lines, with the [-2]/8 to [+2]/8 overshoot lines extending the grid above and below. The indicator draws each as a coloured horizontal line and labels it.
On the honesty point: these are horizontal price levels, so on completed bars they do not repaint, a level that printed yesterday is still in the same place today. However, the whole grid recalculates and can jump when the lookback window rolls forward and a new higher high or lower low enters the range, because that changes the octave the frame snaps to. So the levels are stable within a range but will reset to a new grid after a strong breakout. That is recalculation by design, not a hidden repaint of past signals, but you should expect the lines to move when the market makes a fresh extreme.
Murrey Math Lines settings and parameters
The build ships with 39 inputs, but most just control the colour, width and font of each line. The handful below actually change how the grid is built and when it alerts.
| Parameter | Default | What it does |
|---|---|---|
| period | 64 | How many bars back the indicator scans to find the highest high and lowest low that define the range. Smaller values (e.g. 32) make the grid hug recent price and reset more often; larger values (128, 256) give a wider, slower, more stable frame. |
| UpperTimeframe | PERIOD_D1 | The timeframe whose range is measured to build the grid. Set to a higher timeframe (e.g. D1 or W1) to project major levels onto a lower working chart. Set it to the current period to build the grid from the chart you are viewing. |
| StepBack | 0 | Shifts the lookback window back in time by this many bars before measuring the range. Leave at 0 to use the most recent bars; raise it to anchor the grid to an older, already-completed range. |
| TriggerCandle | Previous | Which candle a line cross is checked against for alerts. 'Previous' uses the last fully closed bar so signals are final; 'Current' reacts to the live bar but can change before it closes. |
| LabelSide | Left | Whether the 0/8 to 8/8 text labels print on the left or right edge of the chart. Purely cosmetic, choose the side that does not overlap your other tools. |
| MarkColor | clrBlue | Colour of the small marker character drawn at each line. Set it to a shade that stands out against your chart background. |
| FontSize | 10 | Point size of the line labels and markers. Raise it for readability on high-resolution screens; lower it to reduce clutter on a busy chart. |
| NativeAlerts | false | Pops a native MetaTrader alert window when price crosses a Murrey line. The simplest way to be notified while the terminal is open. |
| EmailAlerts | false | Emails you on a line cross. Requires a working SMTP setup in the terminal's email options before it can send. |
| NotificationAlerts | false | Sends a push notification to the MetaTrader mobile app on a line cross. Needs your MetaQuotes ID configured in the terminal's notification settings. |
Pros and cons (the honest version)
What it does well
- Auto-plots a complete grid of support, resistance and pivot levels with no manual line-drawing required.
- The 4/8 mean line and the 0/8 / 8/8 extremes give clear, objective reaction zones to plan entries and exits around.
- Horizontal levels do not repaint on closed bars, a line that printed earlier stays put while the range holds.
- Can project higher-timeframe levels onto a lower chart, so you trade intraday against major daily or weekly structure.
- Built-in native, email and mobile-push alerts fire on a line cross, so you do not have to watch every tick.
- Runs on both MT4 and MT5 and works on any instrument and timeframe.
Where it falls short
- The whole grid recalculates and can jump to a new set of levels when a fresh higher high or lower low enters the lookback window.
- The lines are zones of interest, not signals, price ignores them as often as it respects them, especially in strong trends.
- Choosing the period and upper timeframe is subjective; different settings produce different grids, and there is no single correct frame.
- It tells you nothing about direction or momentum on its own; it only marks where reactions are more likely, not which way price will go.
- In a fast, news-driven move price can slice through several eighths without pausing, making the levels look meaningless until the range resets.
- Used alone it has no edge, it needs a trigger such as a candlestick reversal, momentum reading or trend filter to be tradable.
Download Murrey Math Lines free
Enter your email and we'll send you Murrey Math Lines for MT4, packaged with its original Apache-2.0 licence and author credit. Come back for any of our other free indicators whenever you want one.
We never share or sell your email. One-click unsubscribe in every message.
How to install Murrey Math Lines on MetaTrader 4
- Download the free Murrey Math Lines zip file from the link on this page.
- Extract the zip and locate the .mq4 file (use the .mq5 file if you are on MetaTrader 5).
- In MetaTrader, open File → Open Data Folder, then go into MQL4/Indicators (or MQL5/Indicators on MT5).
- Copy the indicator file into that Indicators folder.
- Restart MetaTrader, or right-click the Navigator panel and choose Refresh so the indicator appears.
- Drag Murrey Math Line X from the Navigator onto your chart.
- In the inputs tab, set the period and upper timeframe, enable alerts if you want them, and click OK.
Murrey Math Lines FAQ
Does the Murrey Math Lines indicator repaint?
Not on closed bars, the lines are horizontal price levels, so a level that printed on a completed bar stays exactly where it was. What does change is the whole grid recalculating when a new higher high or lower low enters the lookback window, because that shifts the range to a different Murrey octave. So the levels are stable while a range holds but will reset after a strong breakout. That is recalculation by design, not a retroactive repaint of past signals.
What do the 8/8, 4/8 and 0/8 lines mean?
They are the eighths of the mapped range. The 8/8 line is the top (ultimate resistance) and 0/8 the bottom (ultimate support) of the current frame. The 4/8 in the middle is the mean or major-reversal line that price tends to return to. The 2/8 and 6/8 lines are strong pivot and reversal zones, and the lines above 8/8 and below 0/8 mark overshoot extremes.
What is the best timeframe and period for Murrey Math?
There is no single best setting. A common approach is to keep the default 64-bar period and build the grid from a higher timeframe such as D1 or W1, then trade the reactions on H1 or M15. Lower the period for a tighter, faster-resetting grid or raise it for a wider, more stable one, and test it on your own market before trading it.
Does Murrey Math Lines work on MT5 as well as MT4?
Yes. This version ships for both MetaTrader 4 and MetaTrader 5. Use the .mq4 file for MT4 and the .mq5 file for MT5, and place it in the matching Indicators folder. The grid logic and inputs are the same on both platforms.
Is this Murrey Math indicator free?
Yes, it is completely free to download and use. It was coded by EarnForex.com from Vladislav Goshkov's work and is shared here under its open licence, with no trial limit, no licence key and no payment required.
Can I trade off the Murrey Math lines alone?
It is risky to. The lines mark where reactions are more likely, but price ignores them as often as it respects them, especially in strong trends. Most traders use the grid for context and wait for a confirming trigger, a candlestick reversal at a level, a momentum reading, or a higher-timeframe trend filter, and always trade with defined risk.