Support & Resistance Indicator for MT4 (Free Download)
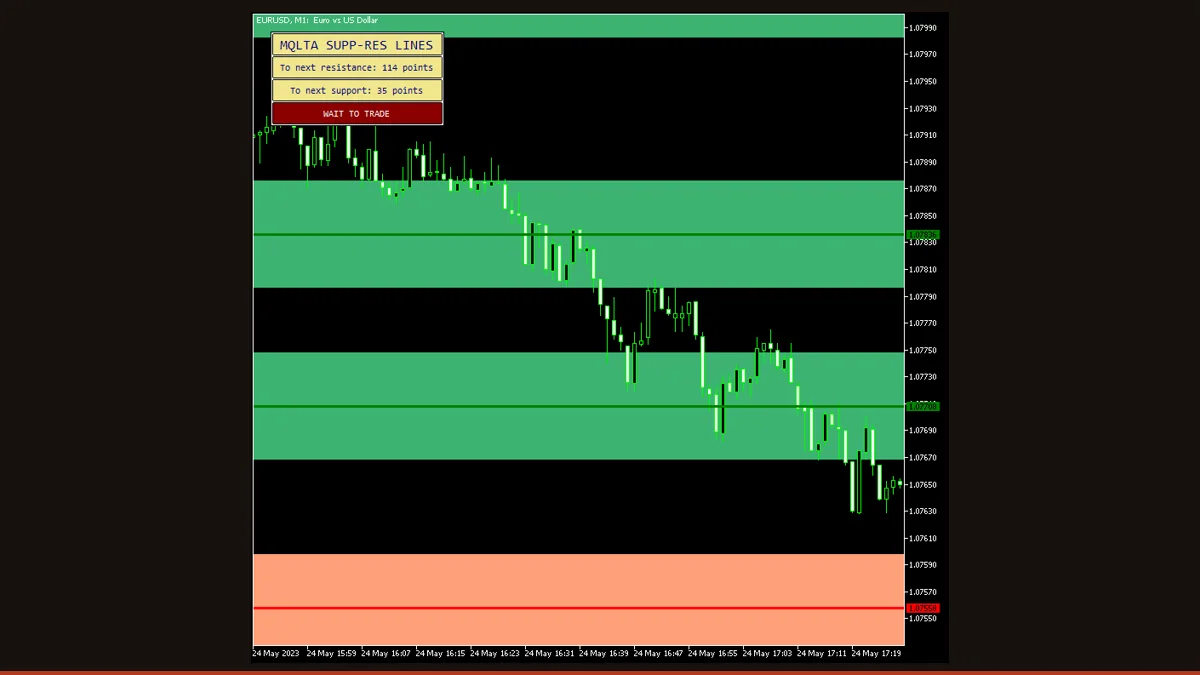
Support & Resistance Lines is a free MT4 indicator that finds swing highs and lows with the Fractals indicator, clusters the ones that line up using ATR, and draws horizontal support and resistance levels where price has actually reacted. It also alerts you when price enters a 'danger' zone too close to a level or a 'safe' zone away from one.
Drawing support and resistance by hand works, but it is slow and it drifts with your mood, on a bad day every wiggle looks like a level. This indicator does the same job mechanically: it scans recent price for the swing points that matter, groups the ones that repeat, and prints clean horizontal lines you did not have to argue yourself into.
This is a free, license-clear MT4 build of EarnForex's Support and Resistance Lines, assembled from two standard tools you already trust, the Fractals indicator and Average True Range. Below we explain exactly how it derives each level, which settings actually change its behavior, the danger/safe zone alerts, and the honest limits of any automated level-finder.
What is the Support & Resistance indicator?
Support & Resistance Lines is an MT4/MT5 indicator that automatically plots horizontal support and resistance levels by detecting fractal swing highs and lows and merging nearby ones into zones using an ATR-based tolerance.
Support and resistance are simply prices where the market has turned before, a floor buyers defended or a ceiling sellers capped. Traders draw them by eye, but two people rarely draw the same lines. This tool replaces the guesswork with a fixed rule set: it uses the Bill Williams Fractals indicator to mark every confirmed pivot, then uses ATR to decide which of those pivots are close enough to count as the same level. The output is a small set of objective horizontal lines and a control panel, not a buy/sell arrow. It marks where price has reacted; what you do there is up to your strategy.
How does the Support & Resistance indicator work?
The indicator builds its levels in a few mechanical steps. There is no black box here, both ingredients are standard MetaTrader indicators.
1. Find the swing points with Fractals. It runs the Fractals indicator across the last MaxBars candles. A fractal high is a candle whose high is higher than the two candles on each side of it; a fractal low is the mirror image. These are the pivots, the places where price actually reversed. Crucially, a fractal needs candles on both sides to confirm, so the newest one or two bars cannot yet form a fractal.
2. Measure the market's noise with ATR. Average True Range tells the indicator how much this pair typically moves. That figure becomes the clustering tolerance: on a volatile pair the bands are wider, on a quiet pair they are tighter, so the same logic adapts to GBP/JPY and EUR/CHF without you re-tuning anything.
3. Cluster pivots into levels. Fractals that sit within an ATR-sized distance of each other are treated as the same support or resistance, three swings that all stalled around 1.0850 collapse into one line at 1.0850 instead of three nearly-identical lines. The result is a clean set of horizontal levels (or shaded zones), with the count controlled by SRAccuracy.
4. Watch the danger and safe zones. SafeDistance (in points) defines a buffer around each level. When price pushes inside that buffer it is in a 'danger' zone, close to a level where a reaction is likely; when it sits well clear of every level it is in a 'safe' zone. The indicator can fire a native, email, or push alert on those transitions so you do not have to stare at the screen.
On the repainting question, be precise: because a fractal only confirms after the candles on both sides close, every level the indicator draws is anchored to closed price action and does not redraw once printed. What does change is the set of levels going forward, as new fractals confirm and old bars scroll past the MaxBars window, new lines appear and stale ones drop off. That is the indicator updating with the market, not rewriting history behind your back.
Support & Resistance settings and parameters
This build exposes 36 inputs, and most are cosmetic, colors, line styles, panel position, and alert plumbing. These are the parameters that genuinely change which levels you see and when you get alerted:
| Parameter | Default | What it does |
|---|---|---|
| SRTimeframe | Current | Which timeframe the fractals and ATR are read from. Set it higher than your chart (e.g. H4 on an M15 chart) to plot the bigger, more-respected levels on top of your trading view. |
| SRAccuracy | Medium | How many levels are drawn. Low gives you only the strongest, most-clustered lines; High exposes more minor swings. Raise it for context, lower it to declutter. |
| SafeDistance | 50 | The buffer in points around each level that defines the 'danger' zone. Widen it to be warned earlier as price approaches; tighten it to only alert on a near-touch. |
| FillBuffersWith | Levels | Chooses whether the indicator's data buffers hold the level prices or zone boundaries, this is what an Expert Advisor or another indicator reads when it references the lines programmatically. |
| BarsToIgnore | 0 | Skips the most recent N candles when hunting for fractals. Increase it if you want levels built only from older, settled price action and not from the still-forming right edge. |
| MaxBars | 500 | How far back the scan looks for swing points. More bars find older, longer-term levels but cost performance; fewer bars keep the focus on recent structure. |
| MaxRange | 0 | Caps how far in points above and below current price the indicator will draw levels. 0 means no limit; set a value to hide far-away lines that are not relevant to today's trade. |
| PanelCorner | Left Upper | Which chart corner the on-screen control panel docks to. Move it if it covers your price action or other indicators. |
| Xoff / Yoff | 20 / 20 | Horizontal and vertical spacing of the control panel from its chosen corner, in pixels, fine-tune so the panel sits exactly where you want it. |
Pros and cons (the honest version)
What it does well
- Removes the subjectivity from drawing S/R, the same rules produce the same levels every time, so you are not arguing with yourself about which wiggle counts.
- Levels are anchored to confirmed fractals on closed candles, so a line does not move or vanish once it is printed.
- ATR-based clustering adapts automatically to each pair's volatility, so it behaves sensibly on quiet and wild pairs without re-tuning.
- Multi-timeframe input lets you overlay higher-timeframe levels onto a lower-timeframe chart for cleaner context.
- Built-in danger/safe zone alerts (native, email, and push) flag when price nears or clears a level so you do not have to watch constantly.
- Completely free with the source available, and the same codebase runs on both MT4 and MT5.
Where it falls short
- It is a level-finder, not a signal generator, it shows where price has reacted but gives you no entry, exit, or direction on its own.
- Fractals need candles on both sides to confirm, so the indicator is inherently a step behind the live edge: the newest swing is never instantly available as a level.
- Because levels are rebuilt from the MaxBars window, the set of lines changes over time as new fractals confirm and old bars age out, individual lines stay put, but the overall picture is not static.
- On strong trends or news spikes, recent price can run well past every drawn level, leaving the lines temporarily behind the market until new fractals form.
- Accuracy and SafeDistance need tuning per pair and timeframe; defaults that declutter EUR/USD on H1 may be too coarse on a scalping chart.
- Like any S/R tool it marks zones, not certainties, price routinely punches through 'strong' levels, and the indicator cannot tell you in advance which holds.
Download Support & Resistance free
Enter your email and we'll send you Support & Resistance for MT4, packaged with its original Apache-2.0 licence and author credit. Come back for any of our other free indicators whenever you want one.
We never share or sell your email. One-click unsubscribe in every message.
How to install Support & Resistance on MetaTrader 4
- Download the indicator zip from this page and save it where you can find it.
- Extract the zip; you should see the .mq4 file (and any included resources).
- In MT4 open File → Open Data Folder, then navigate to MQL4 → Indicators.
- Copy the .mq4 file into that Indicators folder.
- Back in MT4, right-click Navigator → Refresh (or restart the terminal) so the indicator appears.
- Drag Support & Resistance Lines from Navigator onto your chart, set SRTimeframe and SRAccuracy in the inputs, and click OK.
- Optionally tick the alert boxes in the Inputs tab so danger/safe zone notifications fire on your chart.
Support & Resistance FAQ
Does the Support & Resistance indicator repaint?
No, not in the way traders usually mean. Every level is built from fractals, and a fractal only confirms after the candles on both sides have closed, so a line is anchored to settled price action and does not redraw or jump once it appears. What does change is the overall set of lines: as new fractals confirm and old bars scroll out of the MaxBars window, new levels are added and stale ones drop off. The history of each individual line stays honest.
What timeframe works best?
H1 and H4 tend to give the cleanest, most-respected levels because higher timeframes filter out intraday noise. For intraday trading, M15-M30 work well. A popular setup is to leave SRTimeframe one or two steps above your chart (for example H4 on an M30 chart) so you trade with the bigger structure visible underneath.
How is this different from drawing lines by hand?
It uses a fixed rule set instead of judgment: Fractals locate every confirmed swing high and low, and ATR decides which of those swings are close enough to merge into one level. That means the levels are reproducible and free of the bias that creeps in when you draw them manually, but it also means it only sees structure the rules recognize, so combining it with your own read of the chart is still wise.
What are the danger and safe zone alerts?
SafeDistance sets a buffer in points around each level. When price moves inside that buffer it is in a 'danger' zone, close to a level where a reaction is likely, and when it sits clear of every level it is in a 'safe' zone. The indicator can send a native, email, or push alert on those transitions, so you can step away and still know when price is approaching a key line.
Is it really free, and does it work on MT5?
Yes, it is a free download with the source available, and the same EarnForex codebase ships for both MetaTrader 4 and MetaTrader 5, so you can run it on whichever platform you use. Use the MT4 .mq4 build from this page for MetaTrader 4.
Can I use the levels in an Expert Advisor?
Yes. The indicator exposes its levels through data buffers, and the FillBuffersWith setting controls whether those buffers carry the level prices or the zone boundaries. An EA or another indicator can read them with iCustom to reference support and resistance programmatically.