Vortex Indicator for MT4 (VI+ / VI−)
The Vortex Indicator plots two lines, VI+ (positive trend movement) and VI− (negative trend movement), built from each bar's range relative to the prior bar. When VI+ crosses above VI−, an uptrend is starting; when it crosses below, a downtrend is. It captures new trends early but whipsaws in flat, range-bound markets.
The Vortex Indicator is a trend-direction oscillator made of two crossing lines, VI+ and VI−, that measure how strongly price is being pulled up versus down. It was published by Etienne Botes and Douglas Siepman in 2010, and its appeal is simple: the crossover of the two lines tends to mark the beginning of a new trend rather than confirming one that's already half over. That makes it popular with traders who want an early, visual read on which side is winning.
This free, license-clear build is EarnForex's "Vortex Ultimate" (Apache-2.0), which adds three smoothing modes, a multi-timeframe display, and pop-up/email/push alerts on top of the classic two-line calculation. Below we explain exactly how the two lines are computed, give you a plain-English settings table built from the real indicator inputs, and, just as importantly, spell out where the Vortex falls short so you can decide whether it earns a slot on your chart.
What is the Vortex Indicator indicator?
The Vortex Indicator is a two-line trend oscillator: VI+ tracks upward (positive) trend movement and VI− tracks downward (negative) trend movement, and the relationship between the two tells you which direction is in control. You read it the way you'd read a fast and slow moving-average pair, the crossover is the signal, except both lines are derived from price range and direction rather than from a simple average of closes.
The name comes from the Polynesian “vortex” idea the authors used to describe how price spirals between highs and lows: VI+ captures the distance from today's high to yesterday's low, and VI− captures the distance from today's low to yesterday's high. When the up-pull dominates, VI+ rides above VI−; when the down-pull dominates, VI− takes the top. It plots in a separate window below the chart, works on any symbol and timeframe in MetaTrader 4 (this build also ships for MT5 and cTrader), and is genuinely free with clear licensing, no nag screens, no locked features.
How does the Vortex Indicator indicator work?
The Vortex Indicator is built in three short steps, and understanding them tells you exactly what a crossover means.
1. Measure up-movement and down-movement. For each bar the indicator measures two distances. Positive vortex movement (VM+) is the absolute distance from the current bar's high to the previous bar's low. Negative vortex movement (VM−) is the absolute distance from the current bar's low to the previous bar's high. Bars that thrust upward make VM+ large; bars that thrust downward make VM− large.
2. Sum over the period and normalize by True Range. The indicator adds up VM+ and VM− separately over the lookback Period (default 14 bars), and also sums the True Range over the same window. It then divides: VI+ = (sum of VM+) ÷ (sum of True Range), and VI− = (sum of VM−) ÷ (sum of True Range). Dividing by True Range scales the lines so they're comparable across instruments and volatility levels, both lines hover around 1.0, with the dominant one above and the weaker one below.
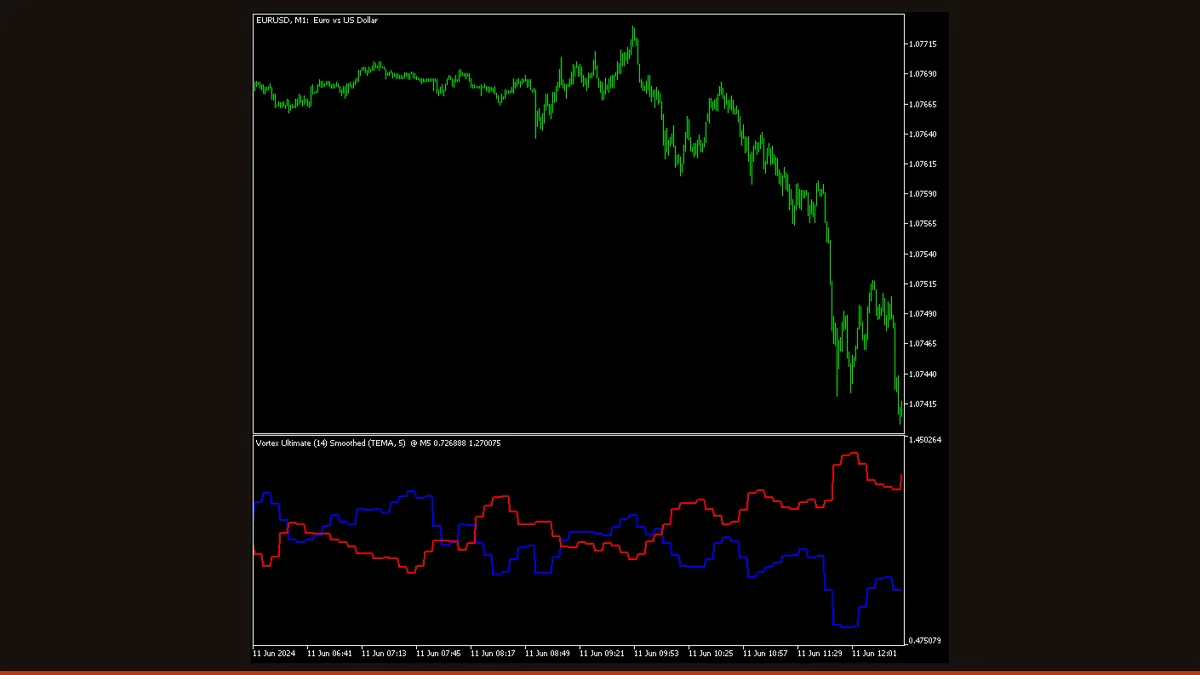
3. The crossover is the signal. When VI+ crosses above VI−, upward movement has overtaken downward movement and a new uptrend is judged to be starting; when VI− crosses above VI+, a new downtrend is judged to be starting. The wider the gap between the two lines, the stronger the prevailing trend; when they converge and tangle, the market is balanced or ranging. This build can additionally smooth the two lines (simple, exponential, or TEMA), pull the calculation from a higher timeframe, and fire an alert at the moment of a crossover so you don't have to watch the screen.
Vortex Indicator settings and parameters
These are the real inputs in the MT4/MT5 indicator. Period and the two smoothing inputs change the math and the feel of the lines; the rest control which timeframe is read and how you're alerted.
| Parameter | Default | What it does |
|---|---|---|
| Period (IndPeriod) | 14 | The lookback window, in bars, over which up-movement, down-movement, and True Range are summed. Shorter periods (7-10) react faster and cross earlier but whipsaw more; longer periods (21-28) give smoother, slower, more reliable crossovers. This is the main tuning dial. |
| Smoothing | 0 | How many extra bars of averaging to apply to the VI+ and VI− lines. 0 leaves them raw and responsive; raising it calms the lines and cuts false crossovers, at the cost of a slightly later signal. |
| Type Smoothing (TypeSmoothing) | SMOOTHING_SIMPLE | Which averaging method the Smoothing setting uses: Simple (even weight), Exponential (weights recent bars more, reacts faster), or TEMA (a triple-smoothed EMA that reduces lag). Exponential and TEMA respond quicker than Simple for the same length. |
| Timeframe (InpTimeframe) | PERIOD_CURRENT | The multi-timeframe source. Leave at current to read the Vortex from the chart you're on, or pick a higher timeframe (e.g. H4 while trading M15) to filter entries by the bigger-picture trend without switching charts. |
| Alert Type (AlertType) | ALERT_TYPE_BOTH | Which crossover triggers an alert: bullish only (VI+ crossing up), bearish only (VI− crossing up), or both. Set to one side if you only trade in a single direction. |
| Alert Candle (AlertCandle) | ALERT_PREVIOUS_CANDLE | Whether alerts evaluate the just-closed bar (Previous) or the still-forming bar (Current). Previous is the safer choice, a crossover on the live bar can disappear before the bar closes. |
| Show Alert (IsShowAlert) | false | Turns on the in-terminal pop-up alert at a qualifying crossover. Leave off if you only want the visual lines. |
| Send Email (IsSendEmail) | false | Emails you on a crossover (requires MT4's SMTP settings to be configured). Useful for being notified away from the terminal. |
| Send Notification (IsSendNotification) | false | Pushes a notification to the MetaTrader mobile app on a crossover. Turn on only the delivery channel you'll actually watch. |
Pros and cons (the honest version)
What it does well
- Catches new trends early, the VI+/VI− crossover tends to fire near the start of a move rather than confirming one that's already mature.
- Easy to read: one crossover, one decision. The line that's on top tells you which side is in control at a glance.
- Self-scaling by True Range, so the same settings behave consistently across pairs and volatility regimes.
- The gap between the lines doubles as a strength gauge, wide and separating means a strong trend, tangled means balance.
- This build adds three smoothing modes (Simple, EMA, TEMA) to trade responsiveness against false signals, plus a multi-timeframe read.
- Built-in pop-up, email, and push alerts on crossover mean you don't have to stare at the chart.
- Genuinely free, Apache-2.0 licensed, and works on MT4, MT5, and cTrader, no locked features.
Where it falls short
- Whipsaws badly in range-bound or sideways markets, the two lines repeatedly tangle and re-cross, producing a string of false signals when there's no real trend.
- It lags by construction: summing range and True Range over the Period means the crossover is a reaction to recent bars, not a prediction. Shortening the Period reduces lag but increases false crossovers.
- The signal on the still-forming bar can change before that bar closes, so a crossover you see mid-bar may not be there at the close, use the Previous-candle alert setting and wait for bar close to avoid acting on a signal that vanishes.
- Smoothing helps with noise but pushes the crossover later, so you trade one weakness (false signals) for another (lateness), there's no setting that removes both.
- On its own it gives direction but not entries, stops, or targets; most traders pair it with a trend or support/resistance filter rather than trading every cross.
- Like all crossover tools, it gives back open profit at the end of a trend, since the exit cross only happens after price has already turned.
Download Vortex Indicator free
Enter your email and we'll send you Vortex Indicator for MT4, packaged with its original Apache-2.0 licence and author credit. Come back for any of our other free indicators whenever you want one.
We never share or sell your email. One-click unsubscribe in every message.
How to install Vortex Indicator on MetaTrader 4
- Download the free Vortex Indicator zip from this page.
- Unzip it and locate the .mq4 file (the MT5 version is .mq5).
- In MT4, open File → Open Data Folder, then go to MQL4 → Indicators, and copy the .mq4 file into that folder.
- Close and reopen MetaTrader 4 (or right-click the Navigator panel and choose Refresh) so the indicator appears.
- In the Navigator, expand Indicators, then drag “Vortex Ultimate” onto the chart you want.
- In the inputs window, set the Period (14 is standard) and choose your smoothing and alert options, then click OK.
- Wait for a confirmed bar close before acting on any VI+/VI− crossover.
Vortex Indicator FAQ
Does the Vortex Indicator repaint?
The closed-bar values do not repaint, once a bar has closed, its VI+ and VI− readings are fixed and won't be redrawn. However, like every indicator the line on the still-forming current bar updates with each new tick, so a crossover you see mid-bar can disappear before the bar closes. Set Alert Candle to Previous and wait for bar close, and you'll only act on settled signals.
What is the best timeframe and period for the Vortex Indicator?
The default 14-bar period on H1, H4, or Daily charts gives the cleanest crossovers for most forex pairs. On lower timeframes (M5-M15) the lines tangle far more often; if you trade there, lengthen the period (21-28) or add smoothing, and consider using the higher-timeframe input as a trend filter.
How do I trade VI+ and VI− crossovers?
The basic rule is: go long when VI+ crosses above VI−, go short when VI− crosses above VI+. Because crossovers are unreliable in flat markets, most traders only take crossovers that align with the higher-timeframe trend or a support/resistance break, and they use a separate stop-loss rule rather than waiting for the opposite cross to exit.
Is this Vortex Indicator really free?
Yes. This is the EarnForex “Vortex Ultimate” build, released under the Apache-2.0 license, with no cost, no trial limit, and no locked features. You can download and use it freely.
Does it work on MT5 as well as MT4?
Yes. This build ships for MetaTrader 4, MetaTrader 5, and cTrader. The MT4 version installs as an .mq4 file in the MQL4\Indicators folder; the MT5 version is the equivalent .mq5 file in the MQL5\Indicators folder.
What's the difference between the smoothing types?
Simple smoothing weights every bar equally and is the steadiest. Exponential weights recent bars more, so it reacts faster to fresh moves. TEMA (triple exponential) is engineered to cut the lag that smoothing normally adds, giving a quicker line than Simple at the same length. More smoothing always means fewer false crossovers but a slightly later signal.