Raghee Horner 34 EMA Wave Indicator for MT4 & MT5
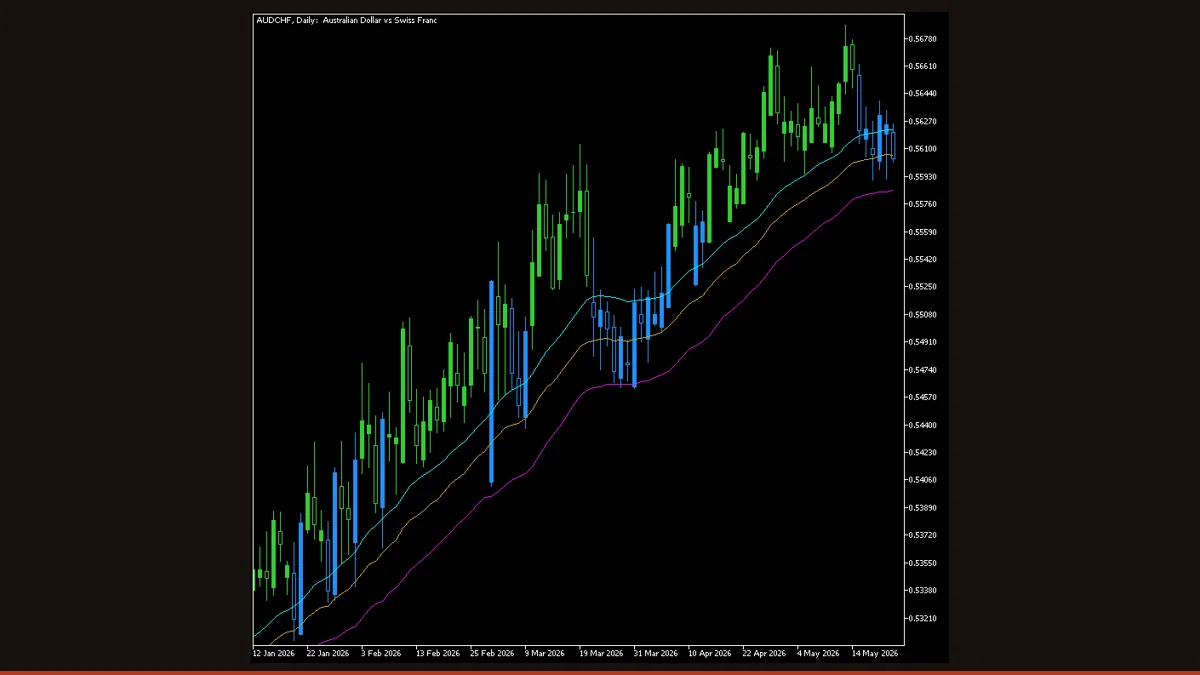
The Raghee Horner 34 EMA Wave plots three 34-period EMAs (of the high, close, and low) as a ribbon and colours your candles green, red, or blue to show whether the market is trending up, trending down, or ranging. The angle of the Wave tells the trend; the GRaB candle colour confirms it. Free for MT4 and MT5.
The 34 EMA Wave is the centrepiece of Raghee Horner's trading method, and it is one of the few moving-average tools built specifically to answer two questions at once: is there a trend, and is it worth trading? Instead of a single moving average, it draws three 34-period EMAs as a ribbon and then recolours your candles based on where they sit relative to that ribbon. A flat, tangled Wave with blue candles says "range, stand aside." A clean, angled Wave with green or red candles says "trend, trade with it."
This free build, originally coded by EarnForex.com and re-hosted here under its open licence, runs on both MetaTrader 4 and MetaTrader 5. It adds optional multi-timeframe operation and native, email, push, and sound alerts on each candle-colour change. Below you will find exactly how the Wave and the GRaB candles are calculated, the settings that actually change behaviour, and an honest account of where the tool helps and where it can mislead you.
What is the Raghee Horner 34 EMA Wave indicator?
The Raghee Horner 34 EMA Wave is a trend indicator that combines a three-line moving-average ribbon with colour-coded candlesticks to show the market's current state, uptrend, downtrend, or range, at a single glance. The three lines are all 34-period exponential moving averages, but each is applied to a different price: one to the bar highs, one to the closes, and one to the lows. Together they form a band that Horner calls the "Wave."
The candles are the second half of the system. The indicator paints each candle green, red, or blue, the "GRaB" candles (Green, Red, and Blue), depending on whether the bar is trading entirely above the Wave, entirely below it, or overlapping it. It is a visual trend-and-regime filter, not a buy/sell arrow generator: it tells you which environment you are in so you can pick the right tactic, rather than firing mechanical entry signals.
How does the Raghee Horner 34 EMA Wave indicator work?
There are two layers to the calculation, and they work together.
The Wave (three 34 EMAs). The indicator computes a 34-period exponential moving average three times, once on each bar's High, once on the Close, and once on the Low. Plotting all three produces a ribbon rather than a line. The thickness of that ribbon reflects the bar range the EMAs are averaging, and, more importantly, the angle of the ribbon is the trend read. A Wave sloping clearly up is an uptrend; a Wave sloping clearly down is a downtrend; a Wave running flat and horizontal means there is no trend and the market is ranging. Horner's rule of thumb is that a roughly 30-degree slope is the threshold for a tradable trend.
The GRaB candles. The indicator then colours each candlestick by its position relative to the Wave. If the entire candle is trading above the top of the Wave, it is painted green (bullish). If the entire candle is below the bottom of the Wave, it is painted red (bearish). If the candle is touching or straddling the Wave, price and the ribbon overlapping, it is painted blue, signalling indecision or a range. A run of green candles riding above an up-sloping Wave is a confirmed uptrend; a cluster of blue candles around a flat Wave is the classic "stay out" condition.
On repainting and recalculation. Be precise here: this indicator is built on EMAs, and an EMA's value on the current, still-forming bar moves with live price until that bar closes, so the newest Wave point and the newest candle's colour can change before the candle finishes. That is normal recalculation, not a marketing claim. On completed bars the Wave and candle colours are final and do not redraw history. The honest caveat is the lag inherent to any moving average: a 34-period EMA is smoothed, so the Wave confirms a trend after it is already under way and signals the end after the turn has begun.
Raghee Horner 34 EMA Wave settings and parameters
Most inputs are display and alert toggles; the few that change the actual read are the period, the MA mode, and the multi-timeframe setting. Here is what each does in plain English.
| Parameter | Default | What it does |
|---|---|---|
| EMA_Period | 34 | The lookback for all three moving averages. 34 is Horner's canonical setting and the reason the tool is named after it. A shorter period (e.g. 21) reacts faster and flags trends sooner but produces more blue/range noise; a longer period smooths further and lags more. |
| MA_Mode | MODE_EMA | Which moving-average formula draws the Wave. Default is exponential (EMA), which weights recent prices more heavily. Switching to simple (SMA) or smoothed makes the Wave slower and less reactive; the method is designed around EMA, so change it only if you are deliberately testing alternatives. |
| TimeFrame | PERIOD_CURRENT | Set this to a timeframe higher than your chart to pull a multi-timeframe Wave onto the current chart (e.g. plot the H4 Wave on an H1 chart). Left at current, it uses the chart's own timeframe. This is how you keep a higher-timeframe trend bias visible while trading lower down. |
| CountBars | 5000 | How many historical bars the indicator calculates. Lower it to speed up loading on slow machines or very long charts; set it to 0 to compute the entire chart history at the cost of slower redraws. |
| ShowEMAWave | true | Master toggle for drawing the three-line Wave ribbon. Turn it off if you only want the GRaB-coloured candles and prefer a cleaner chart without the moving-average band. |
| ShowGRaBCandles | true | Master toggle for recolouring candles green, red, or blue by their position relative to the Wave. Turn it off to keep standard candles and rely on the Wave's slope alone. |
| TriggerCandle | Previous | Which candle a colour-change alert reads. 'Previous' uses the last fully closed bar, so alerts only fire on confirmed colour changes; 'Current' reacts to the live bar but can flip before it closes. Use 'Previous' to avoid acting on an unfinished candle. |
| BullishAlerts | false | Fires an alert when a new green (bullish) candle prints above the Wave. Pair it with the notification channels below to get told when price breaks out of the Wave to the upside. |
| NeutralAlerts | false | Fires an alert when a new blue (neutral) candle prints, i.e. price re-enters the Wave. Useful as a heads-up that a trend may be stalling and a range or pullback is starting. |
| EnableNativeAlerts | false | Pops a native MetaTrader alert window when an enabled candle-colour change occurs. The simplest notification while you have the terminal open; email, push, and sound channels have their own separate toggles. |
Pros and cons (the honest version)
What it does well
- Reads three things at once on a single overlay: trend direction (Wave slope), trend strength, and whether you are in a tradable trend or a range (candle colour).
- The blue-candle / flat-Wave condition is an explicit, visible 'stand aside' signal, a built-in filter that keeps you out of choppy ranges most indicators ignore.
- Built-in multi-timeframe mode lets you overlay a higher-timeframe Wave on a lower-timeframe chart to keep your trend bias and your entries aligned.
- Native, email, mobile-push, and sound alerts fire on each candle-colour change, so you can step away from the screen.
- On completed bars the Wave and candle colours are final and do not redraw history, only the live, forming bar updates as an EMA naturally does.
- Runs on both MT4 and MT5, works on any instrument and timeframe, and is completely free with no licence key.
Where it falls short
- It lags. A 34-period EMA is heavily smoothed, so the Wave confirms a trend only after it is well under way and warns of a reversal only after the turn has begun.
- The current, still-forming bar's Wave point and candle colour move with live price until that bar closes, do not treat the newest candle's colour as final.
- In fast, choppy conditions candles can flip green-blue-red rapidly around a flat Wave, producing conflicting reads with no real trend to trade.
- It is a regime-and-trend filter, not an entry trigger, used alone it gives you no precise stop or target, so you must add your own entry, exit, and risk rules.
- The '30-degree slope' threshold is judgemental and chart-scale dependent; what looks like a trend on one zoom level can look flat on another.
- On strongly trending instruments the blue 'range' colour can appear during normal pullbacks, occasionally shaking you out of an otherwise valid trend.
Download Raghee Horner 34 EMA Wave free
Enter your email and we'll send you Raghee Horner 34 EMA Wave for MT4, packaged with its original Apache-2.0 licence and author credit. Come back for any of our other free indicators whenever you want one.
We never share or sell your email. One-click unsubscribe in every message.
How to install Raghee Horner 34 EMA Wave on MetaTrader 4
- Download the free Raghee Horner 34 EMA Wave zip file from the link on this page.
- Extract the zip and locate the .mq4 file (use the .mq5 file if you are on MetaTrader 5).
- In MetaTrader, open File → Open Data Folder, then go into MQL4/Indicators (or MQL5/Indicators on MT5).
- Copy the indicator file into that Indicators folder.
- Restart MetaTrader, or right-click the Navigator panel and choose Refresh so the indicator appears.
- Drag Raghee Horner from the Navigator onto your chart.
- In the inputs tab, leave the period at 34, set a higher timeframe if you want multi-timeframe mode, enable any alerts you want, and click OK.
Raghee Horner 34 EMA Wave FAQ
Does the Raghee Horner 34 EMA Wave repaint?
On closed bars, no, the Wave points and GRaB candle colours on completed candles are final and do not redraw history. But because the Wave is built from exponential moving averages, the value on the current, still-forming bar moves with live price, so the newest Wave point and the newest candle's colour can change until that bar closes. That is normal EMA recalculation on the live bar, not retroactive repainting of past signals. The cleanest practice is to act on the previously closed candle.
What do the green, red, and blue candles mean?
They are Horner's GRaB candles and they tell you where price is relative to the 34 EMA Wave. Green means the whole candle is above the Wave (bullish), red means it is below the Wave (bearish), and blue means price is touching or inside the Wave, indecision or a range. A run of green candles over an up-sloping Wave is a confirmed uptrend; clusters of blue around a flat Wave are the 'stay out' condition.
What is the best timeframe for the 34 EMA Wave?
There is no single best timeframe. The method was popularised on M15, M30, and H1 intraday charts, with the daily used for swing bias. A common approach is to set the multi-timeframe input to a higher timeframe to read the trend, then time entries on a lower chart. Higher timeframes give fewer, cleaner colour changes; test it on your own market before trading it.
Does it work on MT5 as well as MT4?
Yes. This version ships for both MetaTrader 4 and MetaTrader 5. Use the .mq4 file for MT4 and the .mq5 file for MT5, and place it in the matching Indicators folder. The Wave, GRaB candles, multi-timeframe mode, and alerts behave the same on both platforms.
Is this indicator free?
Yes, it is completely free to download and use. It was coded by EarnForex.com and is shared here under its open licence, with no trial limit, no licence key, and no payment required.
Can I trade the 34 EMA Wave on its own?
It is better used as a filter than as a standalone signal. The Wave and GRaB candles tell you whether you are in a trend or a range and which way that trend points, but they give you no precise entry, stop, or target and they lag because they are built from a 34-period EMA. Most traders combine it with a higher-timeframe bias, a momentum or breakout trigger, and defined risk on every trade.