Rainbow Moving Average for MT4 & MT5
The Rainbow Moving Average plots a fan of up to 66 moving averages of stepped lengths in rainbow colours. When the bands are stacked in order and spread wide, the trend is strong; when they twist together and flatten, momentum is fading. It is a visual trend tool, not a signal generator. Free for MT4 and MT5.
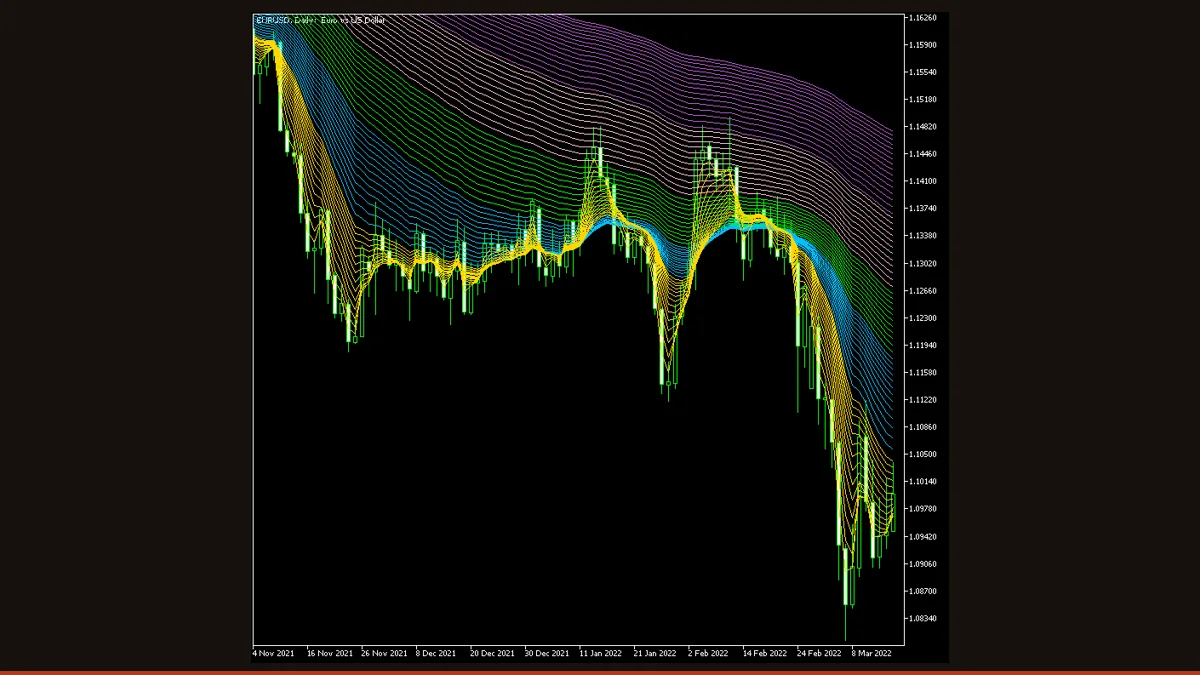
The Rainbow Moving Average turns a single moving average into a whole spectrum. Instead of plotting one line and asking you to guess how strong the trend is, it stacks dozens of moving averages of slightly different lengths on top of each other and colours them like a rainbow. The result is a flowing band that fans out when a trend is healthy and pinches together when it stalls, so you read momentum with your eyes instead of a number.
This free build, originally written by Akuma99 for MetaTrader 4 and later re-coded and open-sourced by EarnForex.com, runs on both MT4 and MT5. We re-host it here under its open licence. Below you will find exactly how the fan is built, the handful of settings that actually change its behaviour, and an honest account of where a 66-line moving-average fan helps you and where it will mislead you.
What is the Rainbow Moving Average indicator?
The Rainbow Moving Average is a trend-visualisation overlay that draws a fan of many moving averages, up to 66 of them, each one a slightly different period, plotted in graduated rainbow colours from the slowest band to the fastest. It is not a single indicator line and it is not an oscillator; it is a way of displaying the entire moving-average family at once so you can see trend direction, trend strength, and the shift between them in one glance.
Conceptually it is the moving-average ribbon idea taken to its limit. A short band reacts quickly to price, a long band reacts slowly, and the dozens of bands in between fill the gap. When all the bands line up in order and run parallel, every timeframe of smoothing agrees on direction. When they cross over each other and bunch up, the different speeds disagree, which is what a stalling or reversing market looks like.
How does the Rainbow Moving Average indicator work?
The logic is simpler than the busy chart suggests. The indicator calculates a set of ordinary moving averages, by default 66 of them, on the same price series, but each with a different lookback period. In the shipped configuration the periods run from a slow 200-bar average down to a fast 2-bar average in stepped increments, and each average gets its own colour so the slowest band sits at one end of the spectrum and the fastest at the other.
You choose the averaging method once and it applies to every band: simple, exponential, smoothed, or linear-weighted (the default here is EMA). You also choose which price each average is built on, close, open, median, typical, and so on. From there it is just dozens of standard moving averages drawn together.
The information lives in the spread and the order of the bands, not in any single line. When price trends up, the fast (short-period) bands sit above the slow (long-period) bands, the whole fan tilts up, and the bands spread apart, wide spacing means strong, accelerating momentum. As a trend tires, the bands stop spreading and start to flatten and converge. When momentum actually reverses, the fast bands cut down through the slow ones and the colour order flips. A tight, tangled knot of bands running sideways is the indicator's picture of a range with no trend to trade.
One honesty point on repainting: each moving average is a backward-looking average of bars that have already closed, so once a bar is final the bands over that bar do not move. The indicator does not retroactively rewrite its history. The only part that updates is the right edge, the bands over the current, still-forming candle shift with live price until that candle closes, which is normal recalculation, not repainting of the past.
Rainbow Moving Average settings and parameters
Most of this indicator's inputs are simply the 66 individual band periods. In practice you almost never touch those; the two inputs that change behaviour are the averaging method and the applied price, plus a few representative period bands you can tune to thin or thicken the fan. Here is what each does in plain English.
| Parameter | Default | What it does |
|---|---|---|
| MA_Type | MODE_EMA | The averaging method used for every band. EMA reacts faster to recent price and turns the fan quicker; SMA is smoother and slower; SMMA and LWMA sit in between. Change this once and all 66 bands switch together. |
| MA_Price | PRICE_CLOSE | Which price each band averages, close, open, median, typical, or weighted. Close is standard. Median or typical price can make the fan a touch smoother by blending the bar's range instead of just the close. |
| MA_Period_01 | 200 | The slowest band in the fan. This sets the long, anchor end of the rainbow, the big-picture trend line everything else is measured against. Raise it for an even longer-term backdrop, lower it to make the whole fan more reactive. |
| MA_Period_10 | 155 | A representative mid-slow band. The cluster of long-period bands like this one forms the thick, slow-moving 'body' of the rainbow that defines the dominant trend. |
| MA_Period_37 | 50 | A representative medium band near the popular 50-period setting. This part of the fan is where trend-strength changes usually become visible first as the bands begin to spread or converge. |
| MA_Period_55 | 13 | A representative fast band. The short-period bands at this end react first to a price turn and are the ones that cut through the slower bands when momentum flips. |
| MA_Period_66 | 2 | The fastest band in the fan, almost price itself. It hugs the candles closely and gives the leading edge of the rainbow. Together with MA_Period_01 it sets the full span of the fan. |
Pros and cons (the honest version)
What it does well
- Reads trend strength at a glance: a wide, fanned-out band means strong momentum, a pinched band means it is fading, no number-crunching required.
- The colour order makes trend direction and the moment of a reversal visually obvious as the fast bands cross the slow ones.
- Does not repaint closed bars, every band is a backward-looking average, so historical bands stay fixed once a candle closes.
- One indicator replaces a stack of separate moving averages, and the spread between bands gives information a single MA cannot.
- Fully configurable: switch the whole fan between EMA, SMA, SMMA, and LWMA, or change the applied price, with one setting.
- Runs natively on both MT4 and MT5 and works on any instrument and timeframe.
Where it falls short
- It lags, every band is a moving average, so the whole fan turns after price does, and the slow bands turn well after the move has begun.
- It whipsaws in ranging markets: the bands tangle into a flat knot and give crossover after crossover with no real trend to catch.
- It is a visualisation tool, not a signal generator, it shows you the trend that already exists, it never predicts the next one.
- Sixty-six overlapping lines clutter the chart and can hide price action, support and resistance, and candle patterns underneath.
- There are no built-in entry, exit, or alert signals; you must define and act on the fan's behaviour yourself.
- On slow machines or very long histories, calculating dozens of averages on every tick can noticeably load the terminal.
Download Rainbow Moving Average free
Enter your email and we'll send you Rainbow Moving Average for MT4, packaged with its original Apache-2.0 licence and author credit. Come back for any of our other free indicators whenever you want one.
We never share or sell your email. One-click unsubscribe in every message.
How to install Rainbow Moving Average on MetaTrader 4
- Download the free Rainbow Moving Average zip file from the link on this page.
- Extract the zip and locate the .mq4 file (use the .mq5 file if you are on MetaTrader 5).
- In MetaTrader, open File → Open Data Folder, then go into MQL4/Indicators (or MQL5/Indicators on MT5).
- Copy the indicator file into that Indicators folder.
- Restart MetaTrader, or right-click the Navigator panel and choose Refresh so the indicator appears.
- Drag the Rainbow Multiple Moving Average from the Navigator onto your chart.
- In the inputs tab, pick the averaging method and applied price, adjust the period range if you want a thinner fan, and click OK.
Rainbow Moving Average FAQ
Does the Rainbow Moving Average repaint?
No, not on closed bars. Each band is an ordinary moving average of bars that have already closed, so once a candle is final the bands over it stay fixed and never move. The only part that updates is the right edge, the bands over the current, still-forming candle track live price until that candle closes. That is normal recalculation of the live bar, not retroactive repainting of past history.
What is the best timeframe for the Rainbow Moving Average?
There is no single best timeframe, but the long default periods (up to 200 bars) make it most meaningful on H1 and higher, where the fan's spread cleanly shows swing-trend strength. It still works intraday on M5 and M15, but the bands tangle more often in noise; if you trade lower timeframes, shorten the slowest periods so the fan reacts to the moves you actually trade.
Is the Rainbow Moving Average a buy and sell signal?
Not on its own. It is a visualisation tool that shows trend direction and strength through the order and spread of its bands, but it prints no entry or exit arrows and has no built-in alerts. Most traders use the fan as context, confirming that momentum is strong and aligned, and take their actual entries from price action, structure, or a separate trigger.
Does it work on MT5 as well as MT4?
Yes. This version ships for both MetaTrader 4 and MetaTrader 5. Use the .mq4 file for MT4 and the .mq5 file for MT5, placing each in the matching Indicators folder. The fan looks and behaves the same on both platforms.
Is the Rainbow Moving Average free?
Yes. This build is open-source, originally coded by Akuma99 and re-coded by EarnForex.com, and we re-host it here as a free download under its open licence. There is no trial, no licence key, and no payment for either the MT4 or the MT5 version.
Why does it slow my terminal down?
Because it calculates up to 66 separate moving averages on every tick, the indicator does far more work than a normal single-line MA. On older machines or very long chart histories this can lag the terminal. Reduce the number of visible bars, trim the period range, or close other heavy indicators if you notice it dragging.